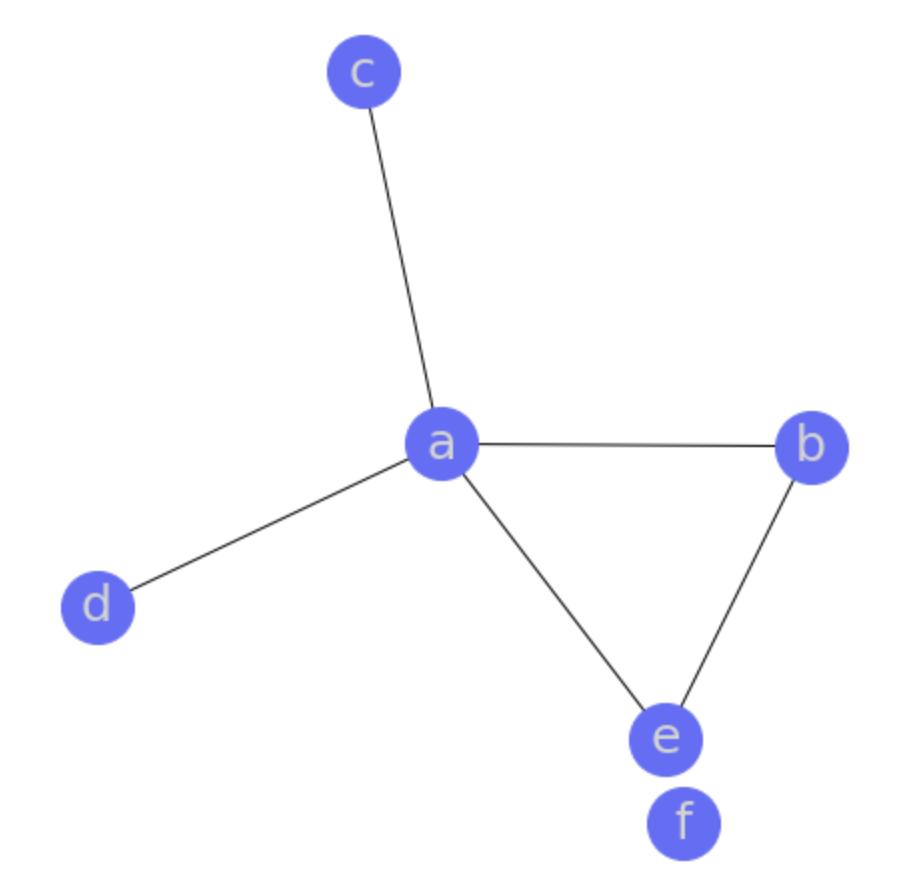
Networkx
import networkx as nx
import matplotlib.pyplot as plt

def draw_graph(graph:  Any, figsize=(6,6), **kwargs):
    G = nx.Graph(graph)
    pos = nx.kamada_kawai_layout(G)
    plt.figure(figsize=figsize)
    default_kwargs = {
        "node_size": 1300, "node_color": "#636EFA",
        "font_size": 25, "font_color": "lightgray",
    }
    default_kwargs.update(kwargs)
    nx.draw(G,pos, with_labels=True, **default_kwargs)

cyclic_graph = {
    'a': {'c', 'd', 'e', 'b'}, 'b': {'e', 'a'}, 'c': {'a'},
    'd': {'a'}, 'e': {'b', 'a'}, 'f': {},
}
draw_graph(cyclic_graph)
Plotly
Use the library (github) explained in this blogpost.
import random
import plotly.express as px
import visualize as gvz
# Optional if you want to upload to chart-studio
import chart_studio.plotly as py

def _node_color(self, *args, **kwargs):
    return random.choice(px.colors.qualitative.Plotly[:3])

cyclic_graph = {
    'a': {'c', 'd', 'e', 'b'}, 'b': {'e', 'a'}, 'c': {'a'},
    'd': {'a'}, 'e': {'b', 'a'}, 'f': {},
}
fig = gvz.GraphVisualization(
    G=nx.Graph(non_cyclic_graph),
    # Describes where to place in 2-D. There are other layouts. The other one I
    # recommend is nx.spring_layout(G)
    pos=nx.kamada_kawai_layout(G),
    node_text_position='top center',
    node_color=_node_color,
    node_size=25,
    node_text_font_size={4: 30},
    edge_color={(0, 1): '#ff0000'},
).create_figure()
fig.show()

# Only if you want to upload to chart-studio
py.plot(fig, filename='Network graph plotting in plotly', auto_open=True)
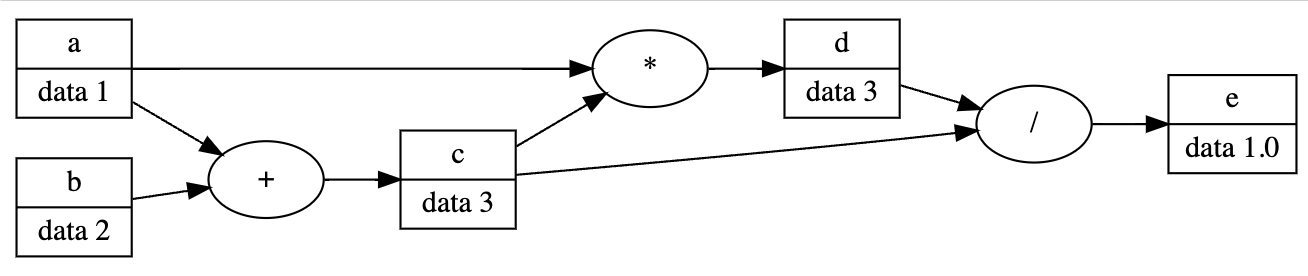
Graphviz
The following code is heavily inspired by Andrej Karpathy’s lectures on deep learning.
import graphviz as gv
import dataclasses as DC
import typing as T

@DC.dataclass
class Node:
    name: str
    val: T.Optional[T.Union[int, float, str]] = None
    #: Which operation created this node. Example "+", "-", "*", "/"
    #: We are setting init to false as we want to create the other nodes before
    #: updating the op.
    op: str  = DC.field(init=False)
    #: Nodes which created this node.
    prev: set['Node'] = DC.field(default_factory=set)

    def __hash__(self):
        return id(self)


def draw_dot(root: Node, only_nodes: T.Optional[set[Node]]=None):
    # LR = left to right
    dot = gv.Digraph(format="svg", graph_attr={"rankdir": "LR"})
    nodes, edges = _trace(root)
    for n in nodes:
        # for any value in the graph, create a rectangular ('record') node for it
        dot.node(name=n.name, label=f"{n.name} | data {n.val}", shape="record")
        if n.op:
            # if this value is a result of some operation, create an op node for it
            dot.node(name=n.name+n.op, label=n.op)
            # and connect this node to it
            dot.edge(n.name+n.op, n.name)
    for n1, n2 in edges:
        # connect n1 to the op node of n2
        dot.edge(n1.name, n2.name+n2.op)
    return dot

def _trace(root):
    """Builds a set of all nodes and edges in a graph"""
    nodes, edges = set(), set()
    _build_trace(v=root, nodes=nodes, edges=edges)
    return nodes, edges

def _build_trace(v, nodes, edges):
    if v not in nodes:
        nodes.add(v)
    for child in v.prev:
        if child is None:
            continue
        edges.add((child, v))
        _build_trace(v=child, nodes=nodes, edges=edges)
"""
c = a+b
d = a*c
e = c / d
"""
a = Node(name='a', val=1)
b = Node(name='b', val=2)
c = Node(name='c', val=a.val + b.val)
d = Node(name='d', val=a.val * c.val)
e = Node(name='e', val=c.val / d.val)

a.op, b.op = None, None
c.op = '+'
c.prev |= {a, b}
d.op = '*'
d.prev |= {c, a}
e.op = '/'
e.prev |= {c, d}